
eBPF Hello, World!
This blog is a short intro to eBPF for people who aren’t heavy coders but want to try it out themselves.
What is eBPF?
eBPF is to Linux what CRISPR is to genes. Think of eBPF as an official, relatively safe way to hack the Linux kernel.
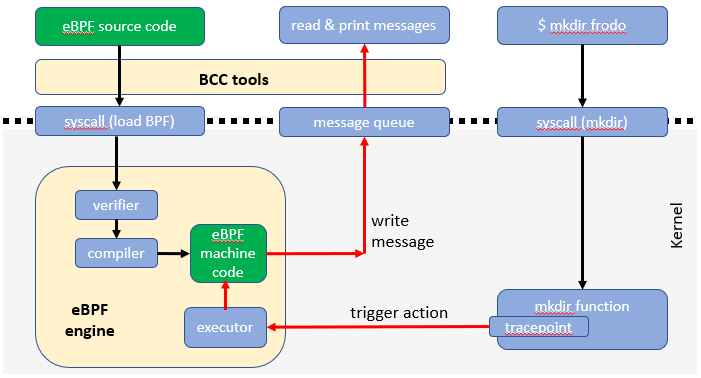
eBPF is an interface added into the Linux kernel in 2014 that lets users inject code to observe or modify kernel behavior. The added code can run immediately: you don’t need to recompile or restart Linux. You also don’t need to share your code with anyone else.
For a hot, emerging technology, eBPF remarkably mature because of who is already using it. Hyperscalers like AWS and Facebook are using it widely across their server fleets to do things like problem detection and live kernel patching. They’re probably doing lots of other stuff with eBPF that they haven’t talked about.
eBPF is an acronym, but the full name does a poor job describing the current technology, so most people call it “eBPF”, or even just “BPF”.
To go deep into the how’s and why’s of eBPF, two people you should follow are Brendan Gregg and Liz Rice.
For people like me who like to try things for themselves, here is a walk-through for a simple “Hello World” eBPF program. However, as Dan Wendlandt of Isovalent told me, programming in eBPF probably won’t become a widespread skill. Instead, eBPF programming will be concentrated on the same specialists who do Linux kernel development or create system monitoring tools.
eBPF Hello, World!
I used Ubuntu 20.04. These instructions should work on both a local computer and on a VM in AWS or Azure. You’ll need two shell windows open; one to load your eBPF program into the Linux kernel, and the other to generate events to trigger your program.
1. Verify your Linux has the required hooks
more /boot/config-$(uname -r) | grep CONFIG_BPF
If the response includes “CONFIG_BPF=y”, you’re probably fine.
2. Install the BPF Compiler Collection tools (BCC)
BCC is a collection of tools to help create and run eBPF programs.
sudo apt-get update
sudo apt-get install bpfcc-tools linux-headers-$(uname -r)
3. Verify BCC and eBPF are working
Run one of the tools included with BCC to make sure they’re set up and can access eBPF: In window 1:
sudo /usr/sbin/bashreadline-bpfcc
In window 2, run commands like ls and whoami. You should see a date stamp, a process idenifier (PID), and your command appear window 1:
$ sudo /usr/sbin/bashreadline-bpfcc
TIME      PID    COMMAND
12:50:57  7029   ls
12:50:58  7029   date
12:50:59  7029   whoami
In window 1, type CTRL+C to exit.
4. Create and run your own program
Copy the code below to a new file listen.py or download it from here.
from bcc import BPF
from bcc.utils import printb

BPF_SOURCE_CODE = r"""
TRACEPOINT_PROBE(syscalls, sys_enter_mkdir) {
   bpf_trace_printk("Hello. Creating new directory: %s\n", args->pathname);
   return 0;
}
"""

bpf = BPF(text = BPF_SOURCE_CODE)

while True:
    try:
        (task, pid, cpu, flags, ts, msg) = bpf.trace_fields()
        printb(b"%-6d %s" % (pid, msg))
    except ValueError:
        continue
    except KeyboardInterrupt:
        break
Run the program using sudo:
sudo python3 listen.py
5. Generate the activity that will trigger your eBPF program
In window 2, create a directory:
mkdir frodo
Back in window 1, you should see the process identifier (PID) followed by your “hello” message. If so, you’ve successfully created and executed an eBPF program!
$ sudo python3 listen.py
To test, open another shell window and create a directory, e.g.
 mkdir frodo
CTRL-C to exit
7419   Hello. Creating new directory: frodo
6. Bonus #1: Peek a little under the kernel hood
By using the observability tool strace when you launch your program, you can observe things like your eBPF program getting loaded into the kernel:
sudo strace -e bpf python3 listen.py
7. Bonus #2: Hook into a different Linux system call
The above example hooked into a built-in tracepoint for a kernel system call involved in the mkdir command. Look for another tracepoint to tap into:
sudo ls /sys/kernel/debug/tracing/events/syscalls
For example, the “sys_enter_execve” call occurs whenever a new program is launched:
sudo more /sys/kernel/debug/tracing/events/syscalls/sys_enter_execve/format
Change your eBPF program to attach to the sys_enter_execve tracepoint, and change which parameter to print out:
TRACEPOINT_PROBE(syscalls, sys_enter_execve) {
   bpf_trace_printk("Hello. Creating new program: %s\n", args->filename);
   return 0;
 }
Run your updated listen program:
sudo python3 listen.py
In your second window, run some commands like ls and you should see those commands listed in window 1, similar to what happened with the built-in tool from BCC in step 3 above.