Using the Azure Monitor Agent to see OS metrics on Ubuntu Pro
This post describes how to use the Azure Monitor Agent to collect OS-level metrics from a Linux VM on Azure.
The Azure Monitor Agent went GA in June of 2021. This agent can collect detailed metrics from inside the OS, like memory utilization. Currently there’s a limitation that these metrics can’t be viewed in Azure Monitor Metrics when using Linux. However, you can view and query the metrics in Azure Monitor Logs today, as described below using Ubuntu Pro.
1. Create an Ubuntu Pro VM with system-managed identity
-
From the Azure Portal home screen, open the “Virtual machines” page, then click Create, and select Virtual Machine.
-
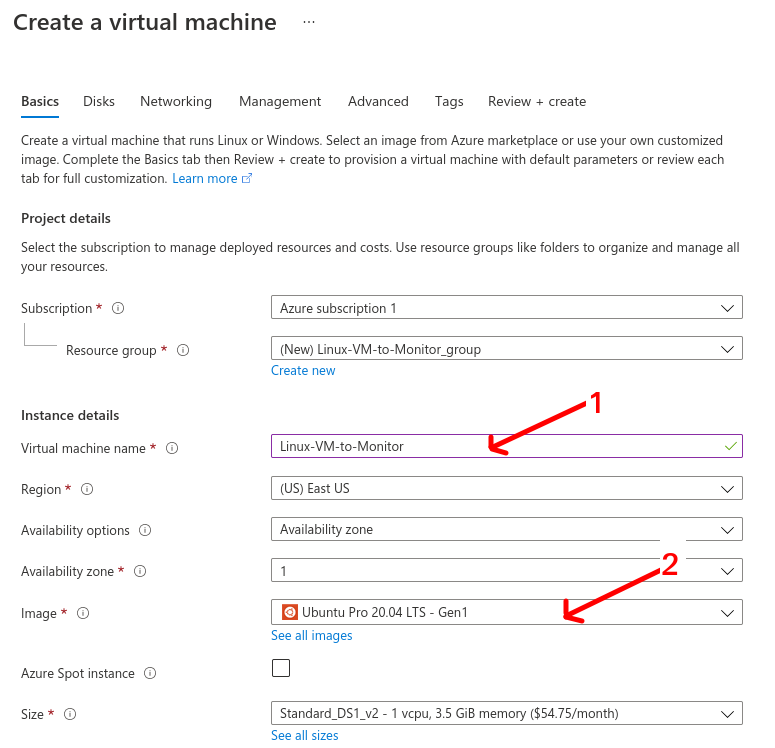
In the “Create a virtual machine” screen, on the “Basics” tab, enter a name for the new virtual machine, and select an “Ubuntu Pro 20.04 LTS - Gen1” image. If you change the Resource Group name, remember the name, you’ll need it later. The rest of the settings on this tab can be left as defaults. Click “Next: Disks”.
-
Disks and Networking can be left as defaults, so click “Next” to the Management tab.
-
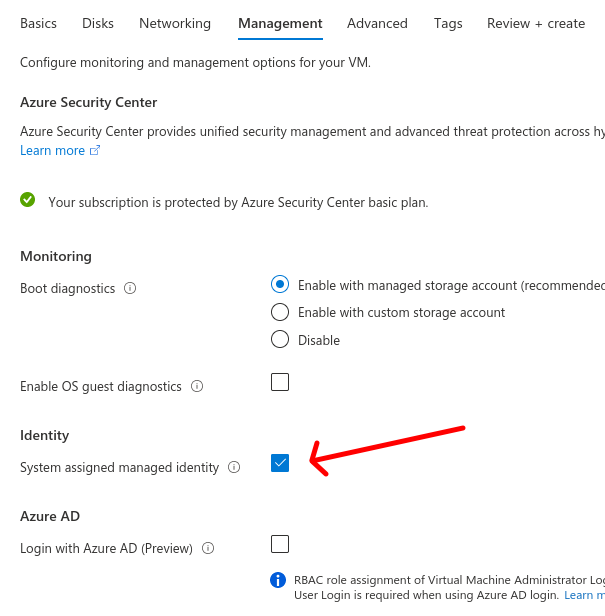
In the Management tab, check the box to enable “System assigned managed identity”. Then click “Next”.
-
The Advanced and Tags tabs can also be left as defaults, so click “Next” until you reach the Create step. Click Create to launch the VM, and wait for this deployment to complete.
2. Create a Log Analytics workspace to hold the performance metrics
- Open the “Log Analytics workspaces” screen. Click Create.
-
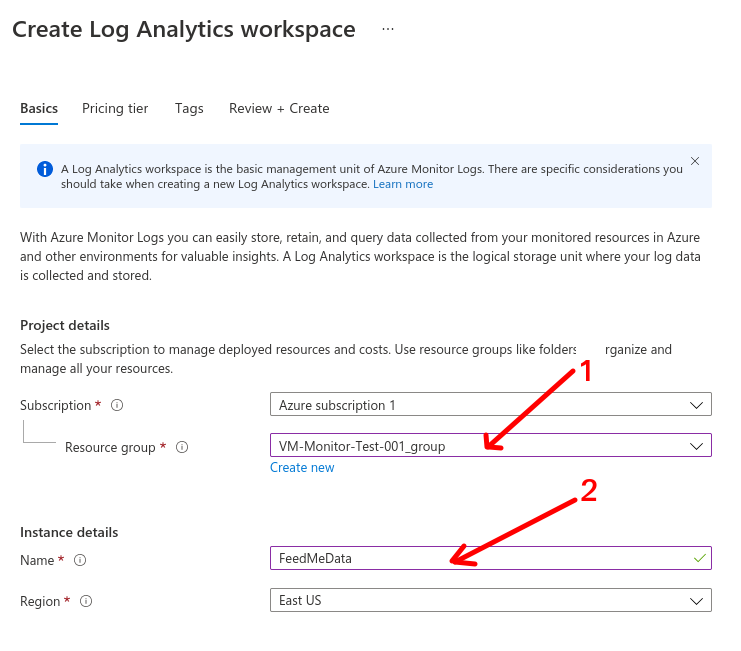
On the Basics tab, select the Resource Group used for the VM. In the Instance details section, enter a name for this new log analytics workspace. I typed ‘FeedMeData’. Make sure the Region matches the one where you launched the VM. Click “Next: Pricing Tier”.
- You can accept the defaults for Pricing Tier and Tags, so continue to the Review + Create tab, and click Create. Wait for the deployment to complete.
3. Configure Data Collection Rules
-
Go to the Monitor dashboard, and scroll down on the left navigation bar to select “Data Collection Rules”.
-
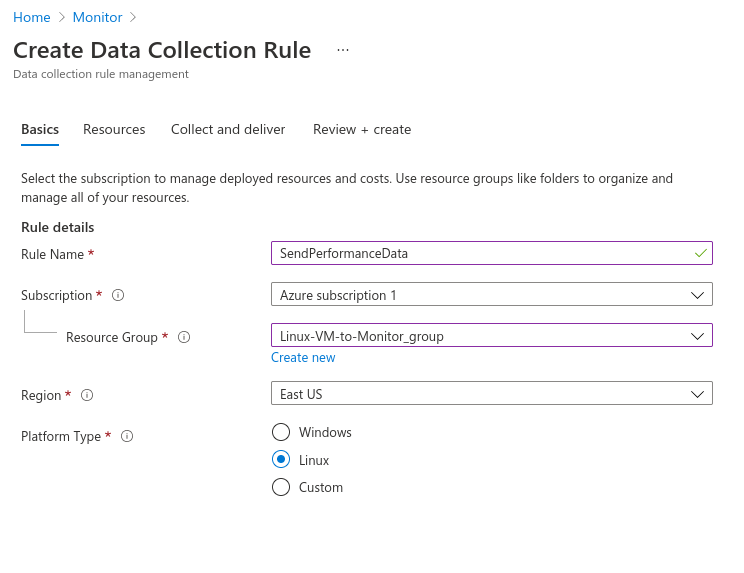
Click Create to make a new DCR. Enter a rule name (I picked ‘SendPerformanceData’), select the same resource group of the VM and Log Analytics workspace, and select the “Linux” button for platform type.
-
On the Resources tab, click Add Resource(s). In the Select a scope screen, click the checkbox next to your VM. (You might have to filter by groups and types to find it.) Once checked, click Apply. Back in the Resources tab, your VM should now be listed at the bottom. Click “Next: Collect and deliver”.
-
Click Add data source. For the data source, choose performance counters. Click Next: Destination.
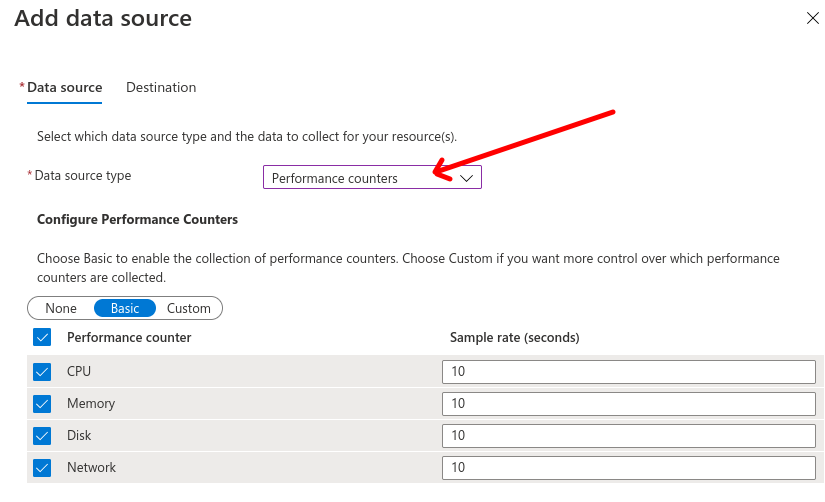
-
For Destination, change the destination type to “Azure Monitor Logs”. In the “Account or namespace”, choose the namespace you created in Step above. Then click “Add data source”. Back in the Create Data Collection Rule window, click Review + create, then Create. Wait for the deployment to complete.
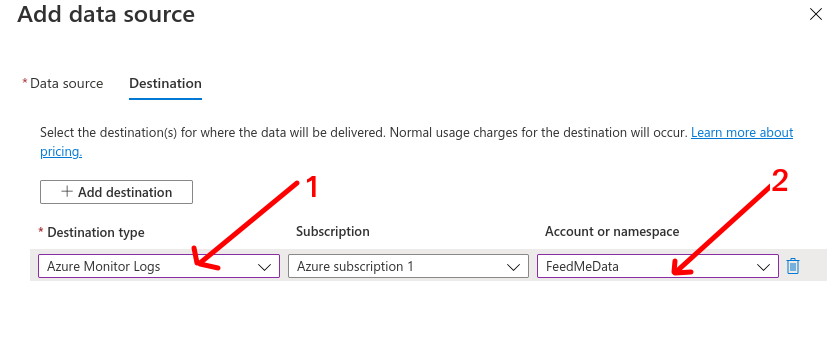
4. Done!
The detailed OS metrics are now being colleced by the Azure Monitor Agent on the Ubuntu Pro VM. The data is sent to the Log Workspace, and can be viewed and queried in Azure Monitor Logs. (For me, it takes 5 to 10 minutes before logs start appearing in Monitor, so just wait a bit if my instructions below don’t work immediately and you instead get “No data” or “we’re getting your data…” messages.)
- Go to the Monitor tool, and select Logs.
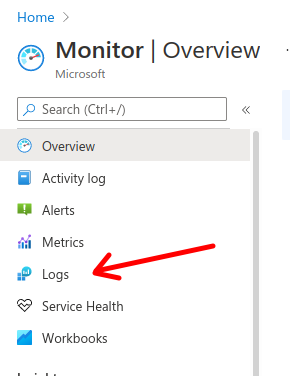
- If the Queries window doesn’t open, click on the Queries link on the top right to open it.
- In the Queries window, scroll down on the left and select Virtual Machines. Then in the center window, click on the “What Data is being collected?” query.
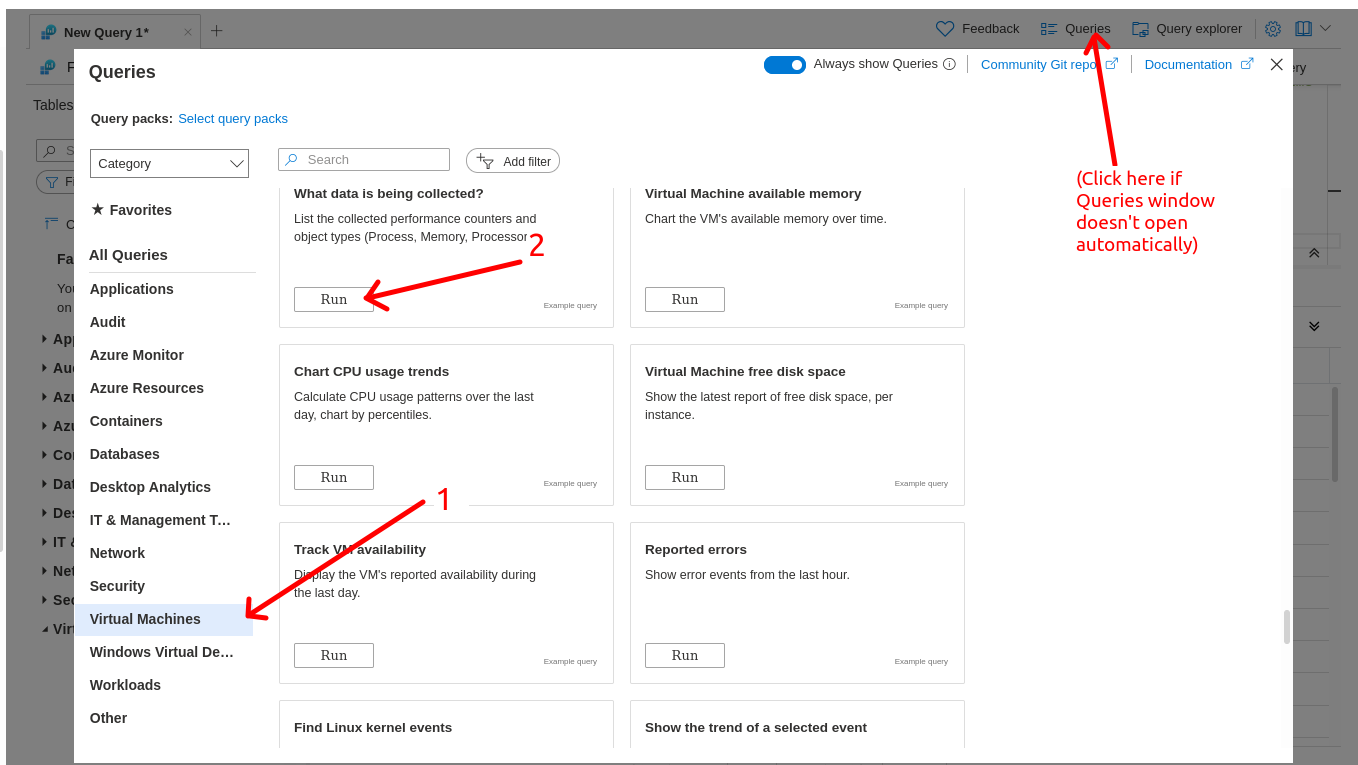
This shows you the list of metrics that are now being read from inside your Linux VM by the agent, and reported to Monitor.
To see one example, click “Queries” on the upper right to bring back the tiles of standard queries, select Virtual Machines again, and click Run in the “Virtual Machine available memory” tile. You should get a chart showing that memory datapoint over time.